SVGnet API Documentation - v0.4.1
SVG Net
![]()


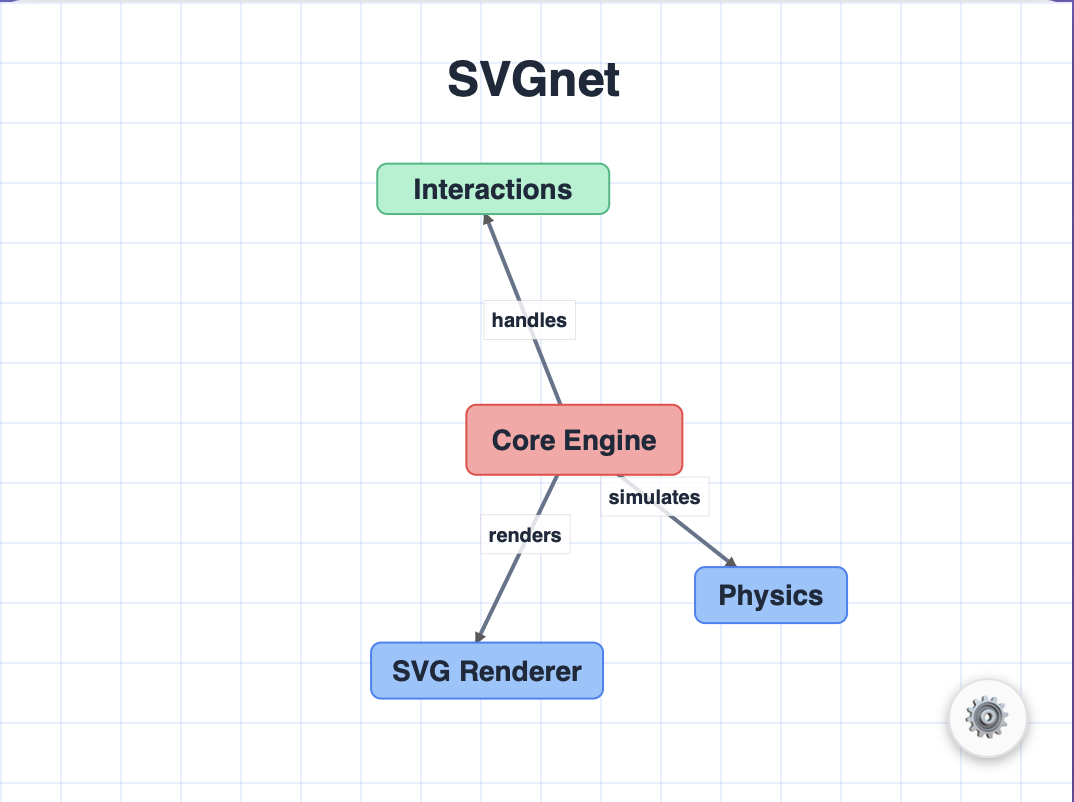
A zero-dependency, TypeScript-first graph visualization library. Force-directed layouts, dark/light theming, mobile touch gestures, and crisp SVG rendering — all in ~28KB gzipped.
Live Demo | API Docs | Examples
Why SVG Net?
- Zero dependencies — No transitive supply chain. One
npm install, nothing else. - 5 lines to a working graph — Opinionated defaults so you skip the boilerplate. D3 is a toolkit; this is a solution.
- TypeScript-first — Designed in strict TypeScript, not retroactively typed. Full type definitions ship with the package.
- Mobile-native — Pinch-to-zoom, touch drag, double-tap filtering built in from day one.
- Themeable — Dark/light modes, automatic color generation for node types, CSS custom properties for full control.
- Small — ~28KB gzipped. Compare to D3 (~90KB) or Cytoscape (~170KB).
- Layout persistence —
exportState()/importState()round-trip node positions, so users don't lose manually arranged layouts. - Custom shapes — Register diamond, hexagon, or any SVG shape via
registerShape(). Built-in: circle, rectangle, square, triangle. - Directed edges — Per-edge
directedflag controls arrowhead rendering. Configurable global default. - Pluggable layouts — Swap the force-directed engine for tree, radial, or grid layouts via the
LayoutStrategyinterface.
Quick Start
Installation
npm install svgnet
Or via CDN:
<script src="https://cdn.jsdelivr.net/npm/svgnet/dist/SVGnet.min.js"></script>
<link rel="stylesheet" href="https://cdn.jsdelivr.net/npm/svgnet/dist/SVGnet.css">
Basic Usage
import GraphNetwork from 'svgnet';
const graph = new GraphNetwork('container-id', {
data: {
nodes: [
{ id: "1", name: "Alice", type: "person", shape: "circle", size: 25 },
{ id: "2", name: "Bob", type: "person", shape: "rectangle", size: 30 },
{ id: "3", name: "Acme Corp", type: "organization", shape: "square", size: 20 }
],
links: [
{ source: "1", target: "2", label: "friends", weight: 2, line_type: "solid" },
{ source: "2", target: "3", label: "works at", weight: 3, line_type: "dashed" }
]
},
config: {
theme: 'dark',
showControls: true,
showLegend: true,
showGrid: true
}
});
API Reference
Constructor Options
interface GraphNetworkOptions {
data: {
nodes: NodeData[];
links: LinkData[];
};
config?: {
// Physics
damping?: number; // Velocity damping (0.35-1.0, default: 0.95)
repulsionStrength?: number; // Node repulsion force (default: 6500)
attractionStrength?: number; // Link attraction force (default: 0.001)
groupingStrength?: number; // Type-based grouping force (default: 0.001)
// Interaction
zoomSensitivity?: number; // Mouse wheel sensitivity (default: 1.01)
filterDepth?: number; // Connection depth for filtering (default: 1)
// UI
showControls?: boolean; // Zoom/control buttons (default: true)
showLegend?: boolean; // Node type legend (default: true)
showTitle?: boolean; // Graph title (default: true)
showBreadcrumbs?: boolean; // Navigation breadcrumbs (default: true)
// Theming
theme?: 'dark' | 'light'; // Visual theme (default: 'dark')
title?: string; // Graph title text
showGrid?: boolean; // Background grid (default: true)
};
}
Data Types
interface NodeData {
id: string; // Unique identifier
name: string; // Display name
type?: string; // Type for styling/grouping
shape?: 'circle' | 'rectangle' | 'square' | 'triangle';
size?: number; // Size in pixels
[key: string]: any; // Custom properties
}
interface LinkData {
source: string; // Source node ID
target: string; // Target node ID
label?: string; // Display label
weight?: number; // Visual weight/thickness
line_type?: 'solid' | 'dashed' | 'dotted';
color?: string; // Custom color
[key: string]: any; // Custom properties
}
Core Methods
// Data Management
graph.setData(graphData); // Replace all data
graph.addNode(nodeData); // Add single node
graph.removeNode(nodeId); // Remove node and connected links
graph.addEdge(linkData); // Add single link
graph.removeEdge(linkId); // Remove specific link
// View Control
graph.resetViewAndLayout(); // Reset zoom and restart physics
graph.fitToView(); // Fit graph to container bounds
graph.zoomIn(); // Programmatic zoom in
graph.zoomOut(); // Programmatic zoom out
// Filtering
graph.filterByNode(nodeId, depth); // Show only connected nodes
graph.resetFilter(); // Show all nodes
// Theming
graph.setTheme('light' | 'dark'); // Change theme
graph.toggleTheme(); // Switch between themes
// Cleanup
graph.destroy(); // Clean up resources
Event System
graph.on('nodeDoubleClick', (data) => {
console.log('Node double-clicked:', data.node);
});
graph.on('themeChanged', (data) => {
console.log('Theme changed to:', data.theme);
});
graph.on('filtered', (data) => {
console.log(`Showing ${data.visibleNodes.length} nodes`);
});
// Available events:
// nodeMouseDown, nodeDoubleClick, filtered, filterReset,
// themeChanged, zoom, resize, reset, nodeAdded,
// nodeRemoved, fitted, destroyed
Mobile Support
Full touch gesture support with responsive UI:
| Gesture | Action |
|---|---|
| Drag background | Pan |
| Drag node | Move node |
| Double-tap node | Filter to connections |
| Double-tap background | Reset filter |
| Pinch/spread | Zoom |
Browser Support
- Desktop: Chrome 60+, Firefox 55+, Safari 12+, Edge 79+
- Mobile: iOS Safari 12+, Chrome Mobile 60+, Samsung Internet 8+
Development
npm install # Install dependencies
npm run dev # Dev server at localhost:8080
npm run build # Production build
npm test # Run test suite
npm run lint # Check code quality
Contributing
See CONTRIBUTING.md for development setup, testing, and PR guidelines.
License
MIT © Darin Chambers